Simple Debugging
Due to errors in the source code, your plugin may encounter runtime errors, as shown below:
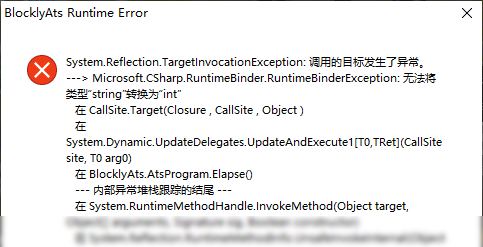
(The dialog will be displayed in your system's language)
Inspect the Error Message
In this example, the error message indicates that the issue is related to data types. However, identifying the exact location of the error is crucial for debugging.
Enable PDB Generation
A Program Database (PDB) file can provide detailed information about the error's location. To enable it, open the "Build & Run Settings" window and check the "Include PDB in output" option.
Now, run your plugin again. The error message should now include a line number:

The line number can typically be found after the path to a C# source file (.cs). If multiple line numbers are displayed, the topmost one is usually the most relevant.
Note: When releasing your plugin, please ensure that PDB generation is disabled and that you do not distribute any .pdb files. Including them not only increases the file size but can also expose sensitive information, such as your local username.
Locate the Faulty Code
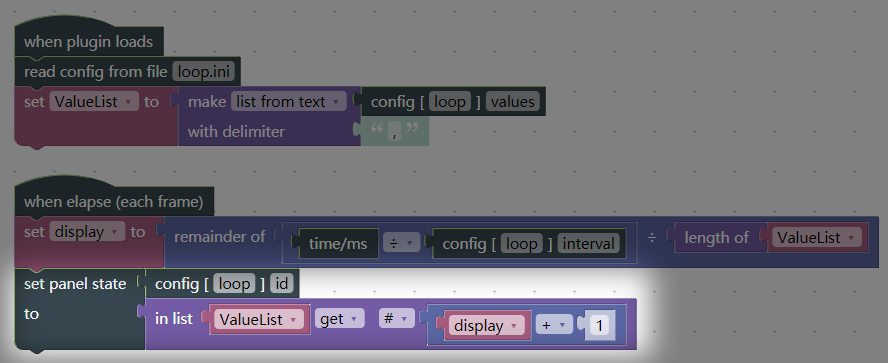
With the line number, you can pinpoint the code that caused the issue. Open the "Debug Window" and find the line that matches the line number from the error message:

Next, identify the block corresponding to the problematic code. You may need to examine the surrounding context, which might require some knowledge of C#. If all goes well, you can trace the generated code back to the specific block that caused the error:
Fix the Error
Many runtime errors are caused by type mismatches. Please read this article for more information about types. If you are unable to determine the cause of the problem, feel free to contact the developers for assistance.